Last year was the year of the AI pilot. This year is the year of "is this thing working?"
Widespread disappointment with AI pilots is creating a backlash. The winners are not the companies with the most AI tools. They are the ones who tied AI outputs to concrete business metrics. For RevOps, that means measuring time saved per rep, meetings booked per signal, and pipeline generated per enrichment dollar.
Related Reading
Building The Context Layer Your Ai Needs To See What You See
Why Revenue Growth Is An Engineering Problem, Not A People Problem
Going Beyond Personalization With Context Engineering
The AI Pilot Hangover
◆ The point
Most companies spent 2025 buying AI subscriptions. Managers checked on usage metrics. Coffee chats were full of "AI wrote my memo" stories. Looking around today, there is widespread disappointment. The question is no longer "are we using AI?" but "is this thing actually working?"
◆ The detail
The disappointment is predictable. Most AI pilots were adopted without clear success metrics. Teams measured activity (how many prompts, how many users logged in) instead of outcomes (how many hours saved, how much pipeline generated, how many deals influenced). Activity metrics always look good in the first 90 days. Outcome metrics take longer to materialize, and when they do, they often tell a less flattering story.
The most useful AI metrics are the ones your revenue operations team can act on: lead quality improvements, response time reductions, and pipeline velocity changes tied directly to AI-powered workflows.
◆ Real-life example
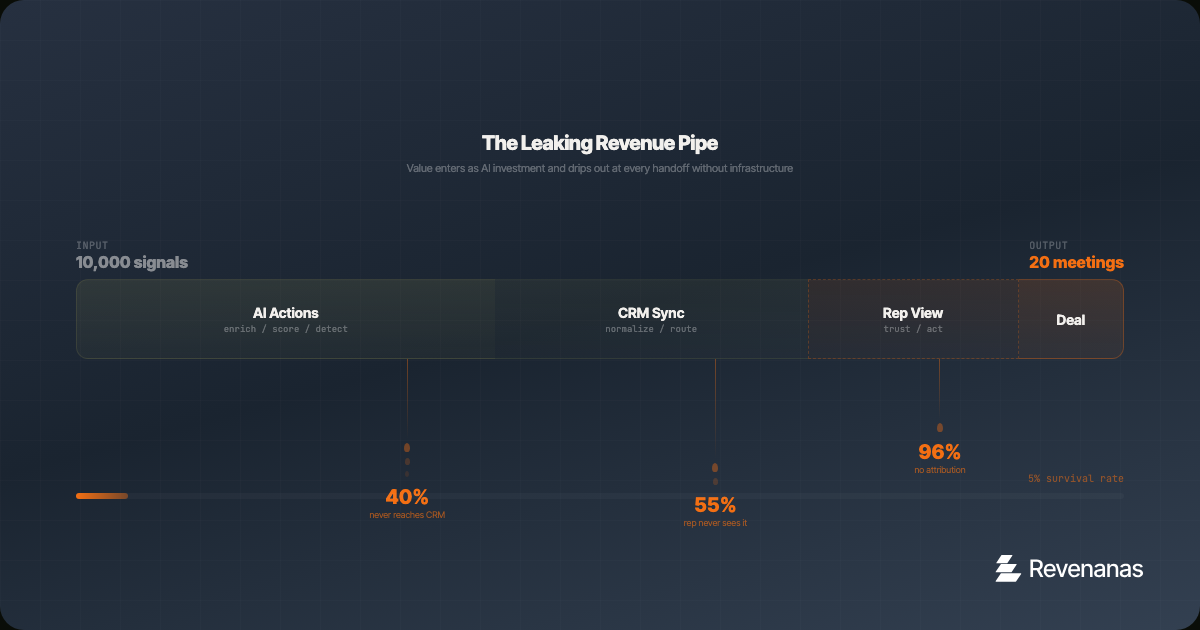
A Series B SaaS company buys an AI enrichment tool. The team runs 10,000 enrichments in the first month. The dashboard shows 95% completion rate. Leadership declares the pilot a success. Six months later, pipeline has not moved. Why? Because nobody measured whether the enriched data actually reached the right reps, triggered the right sequences, or influenced a single deal. The enrichment happened. The revenue impact did not.
This pattern repeats across the industry. AI startups captured 41% of all venture dollars last year, a record high. That money is flowing into tools. But the gap between tool adoption and business impact is where most of that investment stalls.
AI revenue metrics should connect directly to pipeline. Track AI-sourced pipeline value, AI-assisted conversion rates, and time saved on revenue operations workflows. These are the pipeline metrics that prove AI ROI.
The Measurement Gap in Revenue AI
The core problem is that most revenue teams measure AI the way they measure software adoption: usage, engagement, satisfaction scores. These are input metrics. They tell you whether people are using the tool, not whether the tool is producing value.
Revenue AI needs output metrics. Specifically, it needs metrics that connect AI activity to business outcomes through a clear causal chain. Here is what that chain looks like:
1. The AI Action
■ The point
What did the AI actually do? Enrich a record, score a lead, generate a message, detect a signal, summarize a call. This is the input layer, and it is the easiest to measure.
■ The detail
Most teams stop here. They report "we ran 50,000 enrichments" or "AI generated 2,000 email drafts" and call it a win. This is like measuring a factory by how many times the machines turned on. The question is not whether the machine ran. The question is whether it produced something valuable.
2. The Human Action
■ The point
What did a human do as a result of the AI output? Did the rep actually use the enriched data? Did they send the AI-drafted email? Did they act on the signal? This is the handoff layer, and it is where most AI value leaks out.
■ The detail
If your AI enriches 10,000 records but reps only access 500 of them, you have a 95% waste rate. That is not an AI problem. That is an infrastructure problem. The data never reached the rep in a format they trust, at a time they needed it, in a system they actually use. Measuring the handoff layer reveals whether your AI is connected to your workflow or sitting in a silo.
3. The Business Outcome
■ The point
What business result did the chain produce? A meeting booked, a deal advanced, a contract signed, time reclaimed. This is the output layer, and it is the only one that matters to leadership.
■ The detail
Connecting AI actions to business outcomes requires attribution. That means tracking which signals led to which outreach, which outreach led to which meetings, and which meetings led to which pipeline. This is not trivial. It requires structured data, consistent tagging, and a CRM that is set up to capture the chain. But without it, you are spending money on AI with no way to know if it is working.
Five Metrics That Actually Matter
Here are the specific metrics that connect AI investment to revenue outcomes. Each one measures a different part of the chain.
◆ 1. Cost per Qualified Meeting
Take your total AI spend (enrichment credits, API costs, tool subscriptions) and divide it by the number of qualified meetings that originated from AI-influenced outreach. If you are spending $2,000 per month on AI enrichment and it produces 20 qualified meetings, your cost per meeting is $100. Compare that to the cost of a rep doing the same research manually. For most teams, the manual cost is $200 to $400 per meeting when you factor in rep time at fully loaded rates.
◆ 2. Signal-to-Action Time
How long does it take from when AI detects a buying signal to when a rep takes action? If your AI tool surfaces a hiring signal at 9am but the rep does not see it until they check a dashboard three days later, the AI is fast but the infrastructure is slow. Measure the full chain, not just the AI processing time. The goal is hours, not days.
◆ 3. Enrichment Utilization Rate
Of all the records your AI enriches, what percentage are actually viewed, used, or acted upon by a human? This is the single best indicator of whether your AI is connected to your workflow. A utilization rate below 30% means you are burning credits on data nobody uses. Above 70% means your infrastructure is delivering AI outputs where they matter.
◆ 4. Rep Time Recaptured
Measure the hours per week each rep spends on research, data entry, and admin before and after AI implementation. If your AI stack is working, this number should drop by 10 to 15 hours per week per rep. If it has not moved, the AI is adding complexity without removing work. Survey reps quarterly and compare against time-tracking data if available.
◆ 5. Pipeline per AI Dollar
Total pipeline generated from AI-influenced deals divided by total AI spend. This is the ultimate ROI metric. It takes 3 to 6 months to measure accurately because of sales cycle length, but it is the number your CFO cares about. Track it monthly even if the early numbers are noisy. The trend matters more than any single data point.
Building the Measurement Infrastructure
You cannot measure these metrics without the right infrastructure in place. Here is what you need.
◆ Source tagging
Every AI action needs to leave a trace. When AI enriches a record, tag it. When AI generates a message, tag it. When AI detects a signal, tag it. Use a consistent field in your CRM ("AI Source" or "Signal Source") so you can trace any deal back to the AI action that influenced it.
◆ Workflow instrumentation
Your automations need to log key events: when a signal was detected, when it was routed, when a rep viewed it, when they took action. Tools like HubSpot, Salesforce, and Clay can capture these timestamps with the right setup. Without them, you are guessing at the handoff layer.
◆ Regular review cadence
Set up a monthly "AI ROI review" that pulls these five metrics into a single dashboard. It does not need to be fancy. A spreadsheet works. The discipline of reviewing the numbers monthly is more valuable than the tool you use to display them. The review should answer three questions: is our AI spend going up or down, is our output per dollar going up or down, and where is the biggest bottleneck in the chain?
When to Use This (and When Not To)
This measurement framework works well when:
- You are spending more than $1,000 per month on AI tools for revenue operations.
- You have been running AI for at least 90 days and need to justify continued investment.
- Your leadership is asking "what are we getting from AI?" and you do not have a clear answer.
- You are scaling AI usage and need to know where to invest more and where to cut.
This framework is premature when:
- You are in the first 30 days of an AI pilot. Let the team learn the tools before measuring ROI.
- Your CRM data is a mess. Fix the foundation first. You cannot measure signal-to-action time if the signals are not being captured consistently.
- You have fewer than 500 target accounts. At small scale, manual processes may be more efficient than the overhead of building measurement infrastructure.
- Your sales cycle is under 14 days. Short cycles make attribution easier but also make the AI overhead harder to justify.
Key Takeaways
- Stop measuring AI adoption. Start measuring AI outcomes. Usage metrics are vanity metrics for revenue teams.
- The three-layer chain (AI action, human action, business outcome) reveals where value leaks out of your AI investment.
- Five metrics matter: cost per qualified meeting, signal-to-action time, enrichment utilization rate, rep time recaptured, and pipeline per AI dollar.
- Measurement requires infrastructure: source tagging, workflow instrumentation, and a regular review cadence.
- The companies that win with AI are not the ones spending the most. They are the ones measuring the tightest connection between AI input and revenue output.
The AI hype cycle is maturing. The companies that survive it are the ones that can prove, with real numbers, that their AI investment generates revenue. Everything else is just another subscription.