Your CRM is a graveyard. Your tools don't talk. Your reps spend half their day on data entry. This isn't a people problem.
With funding slowing and AI eating venture dollars, the companies that scale are the ones with infrastructure that turns market signals into sales action automatically. The gap between having a strategy and having a system is where revenue dies.
Related Reading
Building The Connective Glue Between Your Tools
Using Clay As Revenue Infrastructure
Signal Infrastructure That Replaces Intent Data Subscriptions
This is where GTM engineering comes in. Instead of throwing more headcount at a broken system, GTM engineering treats revenue growth as a technical problem and builds the connective layer using tools like Clay, custom signal pipelines, and automated enrichment.
The Gap Between Strategy and System
◆ The point
Every company has a revenue strategy. Slide decks. ICPs defined in a Google Doc. A quarterly plan with targets. Most of them also have the tools: a CRM, an engagement platform, maybe a data enrichment tool or two, some BI dashboards.
Revenue growth stalls when CRM data quality degrades. Bad data compounds: duplicate records, missing fields, and outdated contacts create noise that buries real signals.
◆ The detail
The problem is in the middle. The gap between knowing what to do and having the technical infrastructure to do it consistently, at speed, without human beings manually bridging every step. This gap is where revenue dies. There is no system connecting the signal to the action. Every handoff is manual, every transition loses context, and the clock is always ticking.
◆ Real-life example
Consider the typical flow. Marketing identifies a target segment. Someone exports a list into a spreadsheet. That spreadsheet gets cleaned up manually and uploaded to the CRM. A sales rep picks up the lead three days later, spends 20 minutes researching the company, discovers the data is stale, and either sends a generic email or moves on to the next one. Meanwhile, the buying signal that triggered the whole sequence has gone cold.
This is not a people problem. The marketer identified the right segment. The rep was willing to do the work. The failure is structural. We see this pattern repeatedly across companies from Series A to enterprise. The symptoms differ in scale but the root cause is the same: the revenue function is designed as a set of disconnected human processes rather than an integrated technical system.
What Revenue Infrastructure Actually Looks Like
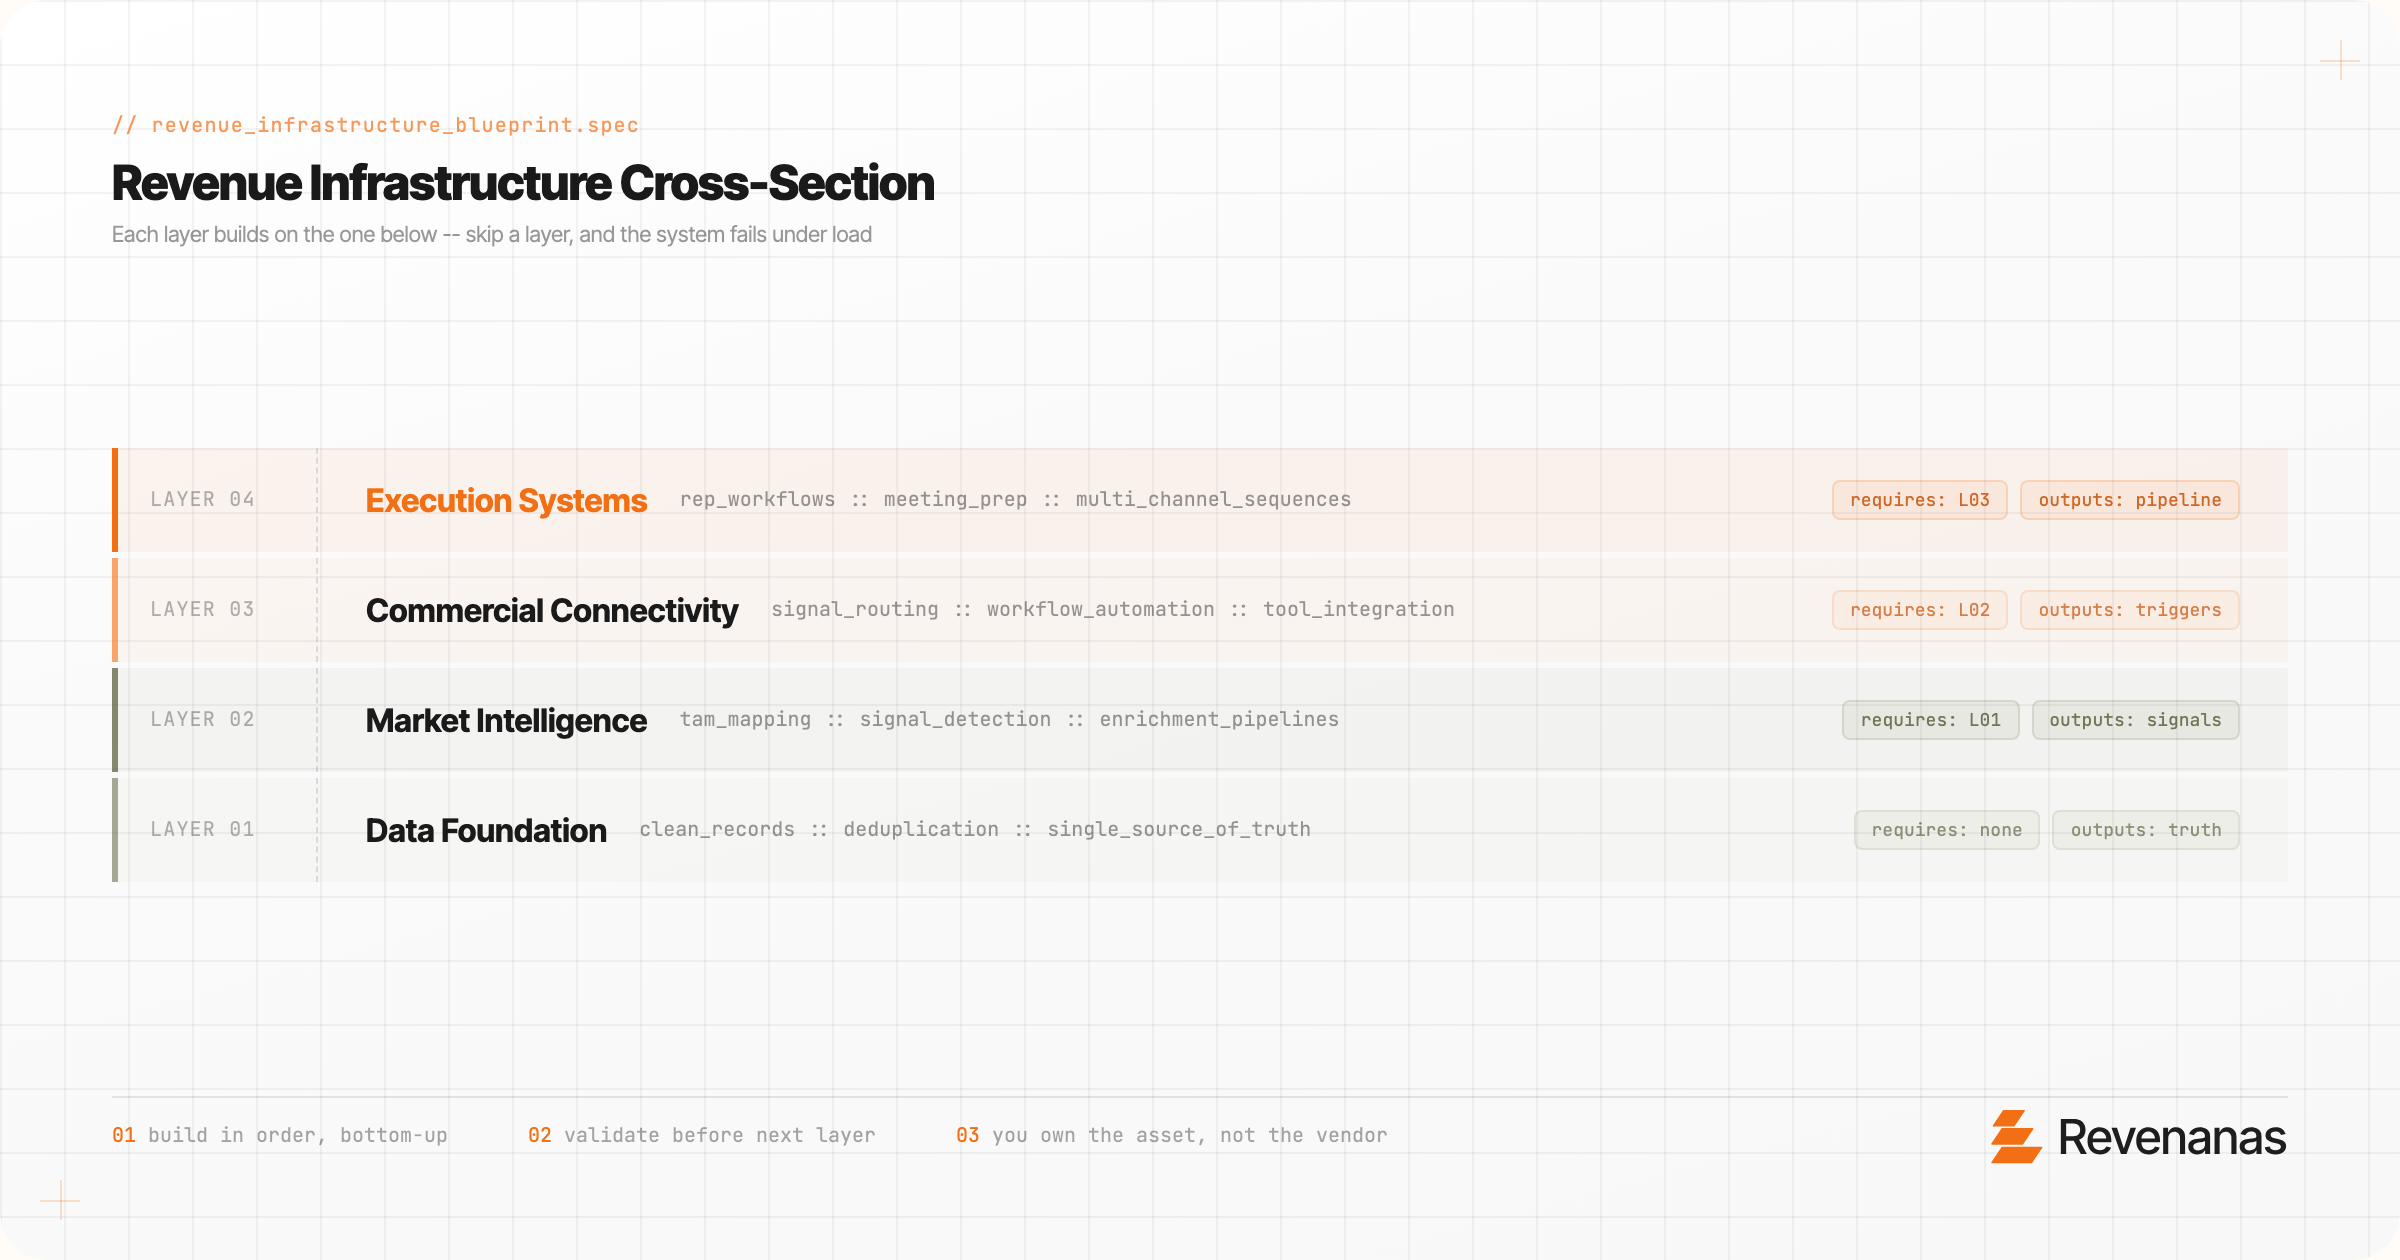
The term "infrastructure" gets thrown around loosely in GTM. Here is what it means when you apply engineering thinking to revenue operations. Revenue infrastructure has four layers, each building on the one below it.
1. Data Foundation
■ The point
This is the boring, essential work. Clean company and contact records. Standardized fields. Deduplication rules. A single source of truth that every system reads from and writes to. Without this, everything above it is unreliable.
■ The detail
The metric that matters here is not "number of records." It is data trust: what percentage of the records in your CRM are accurate enough that a rep would actually act on them today? For most companies we audit, that number is between 30% and 60%. That means 40% to 70% of the CRM is deadweight. Not just useless, but actively harmful, because it wastes time and erodes confidence in the system.
2. Market Intelligence
■ The point
This is where you move from static lists to dynamic monitoring. Instead of building a target account list once per quarter and hoping it stays accurate, you build a system that continuously maps your Total Addressable Market and surfaces changes as they happen.
■ The detail
New companies entering your ICP. Existing accounts showing buying signals: hiring for specific roles, adopting complementary technology, raising funding, or expanding into new markets. The tooling for this has changed dramatically in the past two years. Platforms like Clay allow you to build enrichment workflows that would have required a full-time data engineer to maintain. Combined with AI-powered research, you can monitor thousands of accounts for dozens of signals without adding headcount. The key is not the individual tool but the architecture: how signals flow from detection to action.
3. Commercial Connectivity
■ The point
This is the glue layer, and the one most companies are missing entirely. It is the set of automations, integrations, and workflows that connect intelligence to execution.
■ The detail
When a signal fires, what happens next? Does it update a CRM field? Trigger an alert in Slack? Add the account to a specific outreach sequence with context already populated? Route the lead to the right rep based on territory, segment, or relationship history?
This layer is where engineering discipline matters most. Each connection needs to be reliable, observable, and maintainable. If you build a tangled web of automations that nobody understands, you have replaced one manual problem with an automated one that is even harder to debug. The companies that get this right treat their GTM workflows like software: version controlled, tested, documented, and owned by someone who understands the system end to end.
4. Execution Systems
■ The point
This is the surface layer where humans interact with the infrastructure. Prospecting workflows that surface pre-researched accounts with context. Meeting prep that pulls in recent signals and relationship history automatically.
■ The detail
Multi-channel sequences that adapt based on engagement data. The goal is not to replace reps but to ensure that every minute they spend is on high-judgment activities: building relationships, handling objections, and closing deals, rather than data entry and research that a system can do better and faster.
When these four layers work together, the effect compounds. Clean data feeds accurate intelligence. Accurate intelligence triggers the right workflows. Workflows route context-rich opportunities to reps who can act immediately. Each improvement at one layer makes every other layer more effective.
The Real Cost of Not Building This
◆ The point
The direct cost of manual revenue operations is easy to calculate. If a sales rep spends 15 hours a week on research, data entry, and admin, that is roughly 37% of their time not spent selling. For a team of 10 reps at an average loaded cost of $150,000 per year, you are spending $555,000 annually on work that a well-built system eliminates.
◆ The detail
But the indirect costs are larger and harder to see:
- Speed to market. A competitor with automated infrastructure can identify a buying signal, enrich the account, generate a personalized message, and have a rep reaching out within hours. A team running on spreadsheets and manual processes takes days or weeks. In markets where timing matters, and it almost always does, that gap determines who wins the deal.
- Compounding data debt. Every manual process creates data drift. Records go stale. Fields get inconsistent. Duplicate entries accumulate. We regularly audit CRMs where 30% or more of the records have critical fields that are either empty or outdated. Cleaning that up after three years of neglect is exponentially harder than maintaining it from the start.
- Opportunity cost of misallocation. When RevOps spends their time fixing data instead of architecting growth, when marketing spends their time building lists instead of building strategy, the whole organization operates below its potential. Not because people are lazy or unskilled, but because the infrastructure forces them into low-value work.
◆ Real-life example
There is a useful parallel from Crunchbase's analysis on measuring AI outputs. The argument is straightforward: organizations that focus on measuring AI outputs rather than AI adoption are the ones that actually capture value. The same principle applies to revenue infrastructure. The question is not "do we have a CRM" or "do we use Clay" but "how many hours per week does our team spend on work that a system could do" and "how fast can we act on a buying signal from detection to outreach?"
With US startup funding slowing sharply and AI consuming 41% of all venture dollars, companies are under more pressure than ever to grow efficiently. The era of throwing bodies at a revenue problem and hoping growth follows is ending.
How to Build This Without Breaking Everything
The most common mistake is trying to build all four layers at once. You end up with a half-finished system that is more complex than the manual processes it was supposed to replace, and nobody trusts it. The better approach is to start at the foundation and build up, validating each layer before adding the next.
◆ Step 1: Audit and Blueprint (Week 1-2)
Map the current state. Where does data live? How does it flow between systems? Where are the manual handoffs? What breaks most often? This audit produces a technical blueprint that shows exactly where the infrastructure gaps are and what order to address them. Most teams skip this step. They jump straight to buying a tool or building an automation without understanding the full picture. The result is local optimization that creates new problems elsewhere.
◆ Step 2: Data Foundation (Week 3-4)
Clean the CRM. Standardize fields. Set up deduplication rules. Build the enrichment workflows that keep records current automatically. This is not glamorous work, but it is the single highest-leverage investment you can make. Everything else depends on it.
◆ Step 3: Intelligence and Connectivity (Week 5-8)
Build the signal detection workflows. Map your TAM programmatically. Set up the automations that connect signals to actions. Start with one or two high-value workflows, such as "new hire signal triggers account research and rep notification," rather than trying to automate everything at once.
◆ Step 4: Execution and Iteration (Week 9-12)
Connect the intelligence layer to your outreach and engagement systems. Build the rep-facing workflows. Measure what is working. Iterate on the signals, enrichments, and automations based on real usage data.
This timeline assumes you have someone with the technical skills to build it. The skillset sits at an unusual intersection: you need someone who understands revenue operations deeply enough to know which workflows matter, and who can also engineer the technical infrastructure to make them work. That combination is rare in traditional hiring markets, which is one reason the fractional model works well. You get the engineering capability without the overhead of a full-time hire for what is ultimately a build-then-maintain effort.
One important principle: build in your own environment. The infrastructure should live in your CRM, your enrichment tools, your automation platforms. If the person who builds it disappears tomorrow, your team should be able to understand, maintain, and extend what was built. This is the difference between building an asset and renting a service.
The Measurement Problem (and How to Solve It)
Most teams measure revenue operations by lagging indicators: pipeline generated, deals closed, revenue booked. These are important but they do not tell you whether your infrastructure is working. By the time a lagging indicator moves, three months have passed and you have no idea which system change caused the shift. Leading indicators for revenue infrastructure are more specific:
- Time from signal to action. When a buying signal fires, how long does it take before a rep makes contact? If the answer is measured in days, you have an infrastructure problem. If it is measured in hours, you are in good shape. If it is measured in minutes, you are operating at a level that most competitors cannot match.
- Data freshness. What percentage of your target accounts have been enriched in the last 30 days? Stale data signals to your team that the system is not trustworthy, which means they stop using it, which makes the data even more stale. This is a death spiral that infrastructure prevents.
- Rep time allocation. What percentage of your reps' week is spent on selling activities versus research, data entry, and admin? If that number is below 60%, you are paying senior salespeople to do junior operations work.
- Workflow reliability. How often do your automated workflows fail or produce incorrect results? Every false positive erodes rep trust in the system. Keep this metric visible and improve it relentlessly.
- Coverage percentage. What percentage of your TAM is being actively monitored for signals? If you have 10,000 target accounts but only 2,000 are in your signal monitoring system, you are blind to 80% of your market. The goal is 100% TAM coverage.
These metrics create a feedback loop. When you measure infrastructure health directly, you can improve it before the lagging indicators start to suffer.
When to Use This (and When Not To)
This approach works well when:
- You have product-market fit and need to scale your go-to-market engine efficiently.
- Your team is spending more time on operations than on selling and relationship building.
- You have at least a basic tech stack in place (CRM, enrichment tool, outreach platform).
- Your market is large enough that manual processes cannot cover it. If you have 50 target accounts, a spreadsheet is fine. If you have 5,000 or 50,000, you need systems.
- You are under pressure to grow without proportionally increasing headcount.
This approach does not work well when:
- You are pre-product-market fit. Do not build a scalable engine for a product nobody wants yet.
- Your sales motion is purely relationship-driven with very few, very large deals.
- Your team is not willing to adopt new workflows. The best infrastructure in the world is useless if reps refuse to use it.
- You do not have someone to maintain the system after it is built. Infrastructure requires ongoing attention.
Key Takeaways
- The gap between "having a strategy" and "having a system" is where revenue dies. Strategy without infrastructure is just a slide deck.
- Revenue infrastructure has four layers: data foundation, market intelligence, commercial connectivity, and execution systems. Build them in order.
- The real cost of manual operations is not just the direct time waste, but the compounding effects of data debt, slow speed to market, and talent misallocation.
- Measure infrastructure health with leading indicators like signal-to-action time, data freshness, and TAM coverage.
- Build in your own environment so your team owns a permanent asset, not a dependency on an external vendor.
The companies that figure this out do not just grow faster. They grow more efficiently, more predictably, and with a structural advantage that compounds over time.